
Applied Material (AMAT) beats Q4 Earnings but YoY Weakness Triggers Selloff
1. Earnings Summary
Applied Material (AMAT) posted record full-year results, but Q4 showed revenue softness, non-GAAP EPS decline, weaker semicap margins, and a large restructuring charge, causing the stock to drop pre-market.
Quarter (Q4 FY25)
- Revenue: $6.80B (–3% YoY)
- GAAP EPS: $2.38 (+14% YoY)
- Non-GAAP EPS: $2.17 (–6% YoY)
- Gross Margin: 48.0% (up YoY)
- Operating Margin: 25.2% (down from 29.0%)
Financial Weak Points
- Semiconductor Systems revenue: $4.76B (–8% YoY)
- Segment margin: 32.1% (down from 35.2%)
- Free Cash Flow: $2.04B (–6% YoY), FY down 24%
- OpEx up sharply: +20% YoY
- Restructuring charge: $181M (workforce reduction)
- U.S. rev down, China remains elevated at 29% (risk)
Guidance (Q1 FY26)
- Revenue: $6.85B ± $500M
- Non-GAAP EPS: $2.18 ± $0.20
→ Essentially flat, not signaling acceleration until 2H 2026.
Earnings Takeaway
Record year, but the quarter was weak on revenue, non-GAAP EPS, margins, and free cash flow. Guidance was neutral. This combination justifies the –4.8% pre-market move.
2. Technicals
Pre-market Price
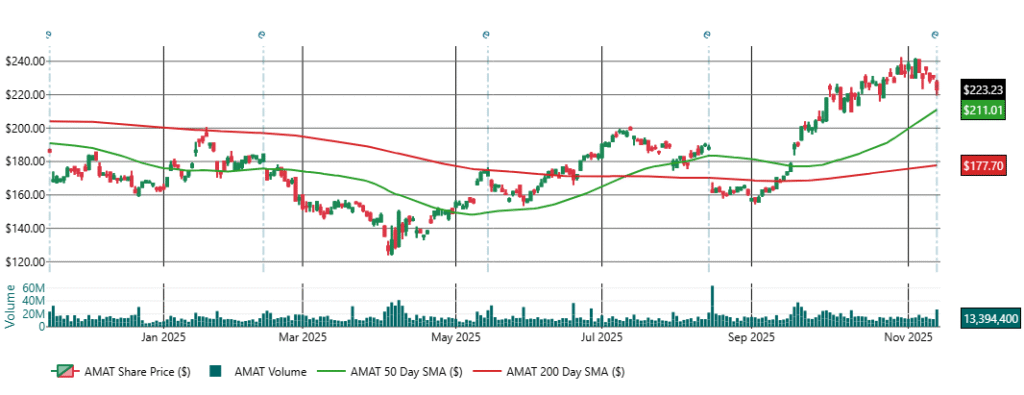
$212.46, down 4.8%, sitting directly on major support.
Key Technical Levels
Critical Support (Now Being Tested)
- $211 → 50-day SMA (major trend support)
- $200 → prior breakout + psychological level
- $177 → 200-day SMA (long-term floor)
→ Earnings drop places AMAT exactly on the make-or-break 50-SMA.
Trend & Patterns
Before Earnings
- Clear uptrend from Sept–Nov
- Bull flag / tight consolidation between $220–$235
- Price above rising 50-SMA → bullish continuation pattern
After Earnings Drop
- The bull flag is at risk of failing if $211 breaks
- If AMAT loses the 50-SMA, momentum shifts from bullish → corrective
- Volume profile shows buying interest on dips, but that must confirm intraday
Upside Scenarios
- Hold above $211 → uptrend intact
- Reclaim $220–$223 → stabilizes
- Break above $235 → continuation toward $250–$260
Downside Scenarios
- Break below $211 → opens a clean air pocket to $200
- Break below $200 → larger correction to $185–$190
- 200-SMA at $177 is deep support, long-term trend remains intact unless that level fails.
3. Combined Earnings + Technical Interpretation
Why the Market Is Selling
The earnings report confirms:
- Revenue decline
- Non-GAAP EPS decline
- Semicap margins down
- FCF down 24%
- OpEx up significantly
- Restructuring charge
- Flat guidance
→ These fundamentals justify breaking the bull flag.
But…
Price is sitting exactly on the strongest support level in the trend (50-SMA at ~211).
This creates a binary setup:
Bullish if:
AMAT holds above $211 and recovers back toward $220–$223.
Bearish if:
AMAT breaks $211 → the earnings weakness becomes a real technical breakdown → target becomes $200.
4. Summary
AMAT’s quarter showed weakening revenue, margins, and free cash flow, which triggered a selloff placing the stock right on its major $211 support — a decisive level that determines whether the uptrend survives or breaks toward $200.
Disclaimer: This analysis was assisted by AI and is for informational purposes only. It is not investment advice, does not account for your personal financial situation, and should not be relied upon for trading or investment decisions. Always conduct your own research or consult a qualified financial professional before making any investment choices.