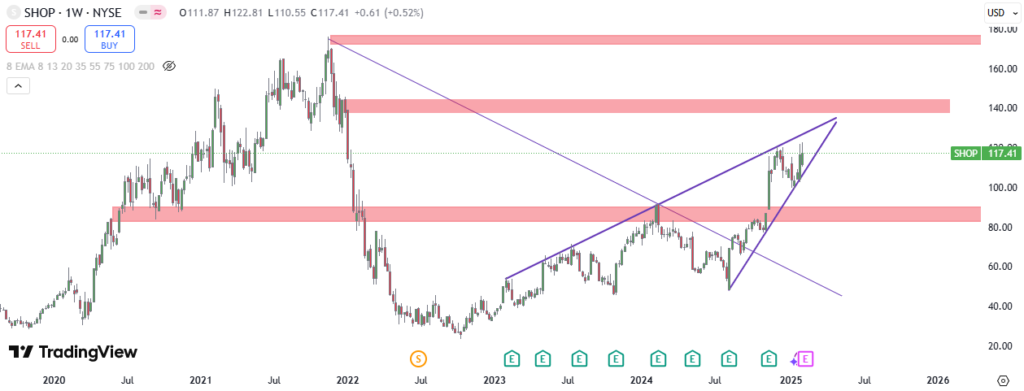
Shopify stock shows bullish momentum with support at key levels, facing resistance at $145.
Shopify (SHOP):
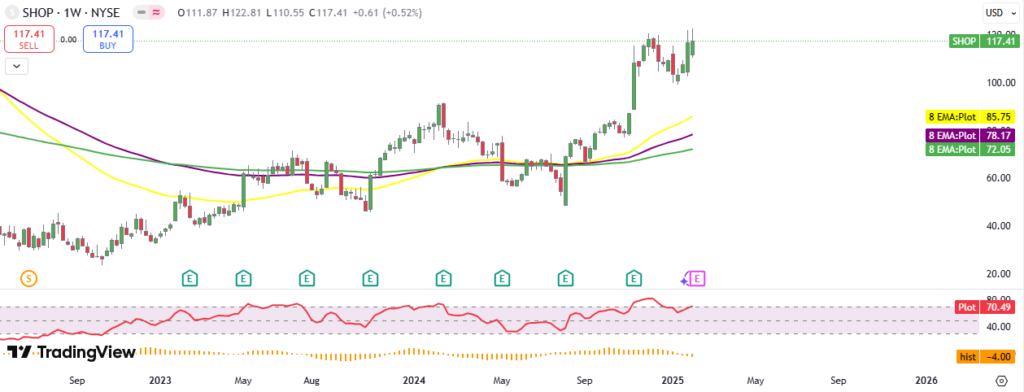
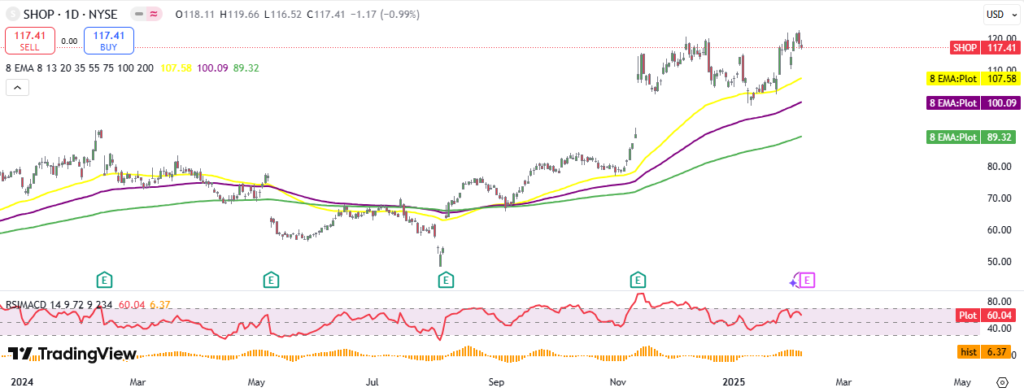
The stock closed the week at $117.41, up 0.52%. It declined 0.99% on Friday.
The price is above the 50, 100, and 200-week EMAs, indicating a long-term bullish bias. The 50, 100, and 200-week EMAs are at $85.7, $78.1, and $72, respectively. The weekly RSI is at 70, and the MACD is bearish.
The price is also above the 50, 100, and 200-day EMAs, reflecting a short-term bullish bias. The 50, 100, and 200-day EMAs are at $107.5, $100, and $89.3, respectively. These EMAs have previously acted as strong support for the stock. The daily RSI is at 60, and the MACD is bullish.
The stock is trading in a wedge and consolidating between $100 and $120. If the wedge breaks to the upside, the next resistance level is around $145. In case of a breakdown, immediate support comes from the 50-, 100-, and 200-day EMAs, with additional horizontal support in the $83–$90 range.