
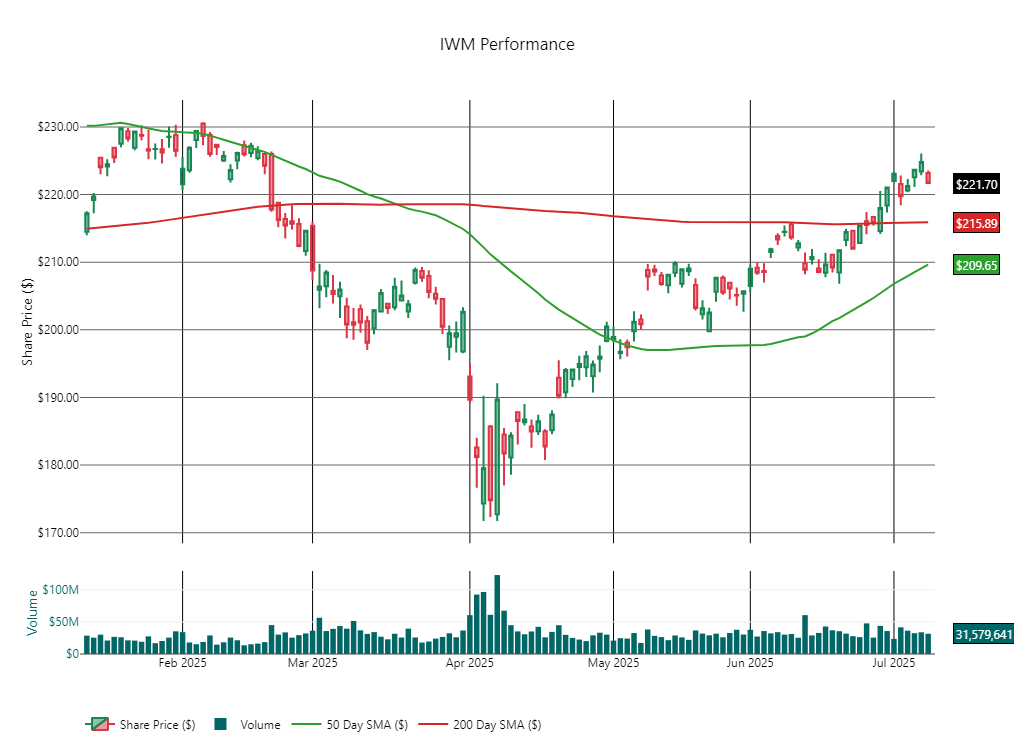
IWM (Russell 2000 ETF) Showing Signs of Technical Breakout
Current Price: $221.70
YTD Performance: +0.33%
Last Updated: July 12, 2025
🧭 Market Context
- The iShares Russell 2000 ETF (IWM), tracks small-cap U.S. stocks, continues to lag behind major indexes like the S&P 500 and Nasdaq year-to-date.
- Dow: +4.3%
- S&P 500: +6.43%
- Nasdaq: +8.42% (near all-time highs)
- Despite this, IWM has recovered from its April lows (~$172) and is showing signs of a technical breakout.
- Risk sentiment: Small caps are more sensitive to economic shifts, interest rates, and credit conditions. Weak small-cap performance may signal investor caution or concern about economic growth.
- Market breadth: A rally led only by large caps, while small caps lag, can suggest narrow market leadership, which may be a sign of a fragile market rally.
📊 Technical Chart Breakdown
📉 Trend:
- IWM is in a bullish trend after forming a base between April and May.
- It has consistently closed above both the 50-day and 200-day SMAs — a classic signal of strengthening momentum.
🔁 Moving Averages:
- 50-day SMA: $209.65 (support)
- 200-day SMA: $215.89 (support)
- A Golden Cross (bullish crossover of 50-day above 200-day) was confirmed in June 2025 — historically a strong upside indicator.
📈 Support Levels:
- $215.89 – 200-day SMA
- $209.65 – 50-day SMA
- $200.00 – psychological and former resistance-turned-support
📉 Resistance Levels:
- $225.00 – near-term resistance (recent highs from January)
- $230.00–$234.00 – major resistance zone from 2021 all-time highs
🔎 Volume:
- Volume has picked up during the rally, adding conviction to the breakout.
📍 Outlook & Opinion
Direction: 🔼 Leaning Bullish
The technical structure suggests IWM is attempting a trend reversal. With price holding above both moving averages and a golden cross in place, momentum favors a test of the $225–$230 range next.
If the broader market remains strong — especially if rate cut expectations persist and small-cap sentiment improves — a break above $230 could open the path to retest the $234–$240 all-time high zone.
However, failure to hold $215.89 or a reversal in macro trends could bring IWM back toward the $209–$200 support area.
⚠️ Key Watch Points
- Can IWM hold above $215 on any pullback?
- Will the Nasdaq-led rally broaden to include small caps?
- Macro triggers: Fed decisions, inflation data, and small-cap earnings growth
✅ Conclusion
IWM is technically sound after a prolonged period of underperformance. If the bullish momentum continues, $225–$230 is the next target, with $234+ in sight if buyers stay in control. But risks remain, especially with macro headwinds and weak breadth.
This report was prepared with AI assistance and is for informational purposes only — it is not trading or investment advice.