
Microsoft (MSFT) Q4 FY2025 Earnings Preview: Analysts Expect Strong Growth
Earnings set to be released after market close on July 30, 2025
🔍 Analyst Sentiment
- Consensus Rating: Strong Buy
- Price Target Range: $580 to $613
- Implied Upside: ~13% from current price of ~$512
- Notable Analyst Calls:
- Citi: Top pick with $613 PT
- Wedbush & Jefferies: Both raised PT to $600
📊 Street Expectations
- Revenue Estimate: ~$73.9B (↑13–14% YoY)
- EPS Estimate: $3.35 to $3.38 (↑14% YoY)
Segment Projections:
- Intelligent Cloud (Azure, etc.): ~$28.9B (+19–22% YoY)
- Productivity & Business Processes (Office, Copilot): ~$32.1B (+58% YoY)
- More Personal Computing (Windows, Gaming): ~$12.6B (↓20% YoY)
💡 Key Themes to Watch
- AI Monetization: Azure and Microsoft 365 Copilot seen driving significant incremental revenue; AI services may now account for 15–16 points of Azure’s YoY growth.
- Operating Margins: Analysts watching for signs of compression due to heavy AI infrastructure investment; margin management critical amid slowing capex in FY26.
- Security & OpenAI Risk: SharePoint breach and questions about OpenAI exclusivity could come up in the Q&A, potentially impacting long-term cloud narrative.
⚖️ Market Setup
- Options-Implied Move: ±4% post-earnings
- Valuation: Trading ~35× forward P/E, suggesting little room for error
- Positioning: Stock up sharply YTD—strong print needed to sustain rally
📝 Takeaway
Analysts are largely bullish heading into earnings, expecting strong AI-led growth and margin resilience. But with the stock priced for perfection, any softness in cloud growth, Copilot adoption, or guidance could trigger volatility.
📊 Microsoft (MSFT) – Fibonacci & Technical Summary
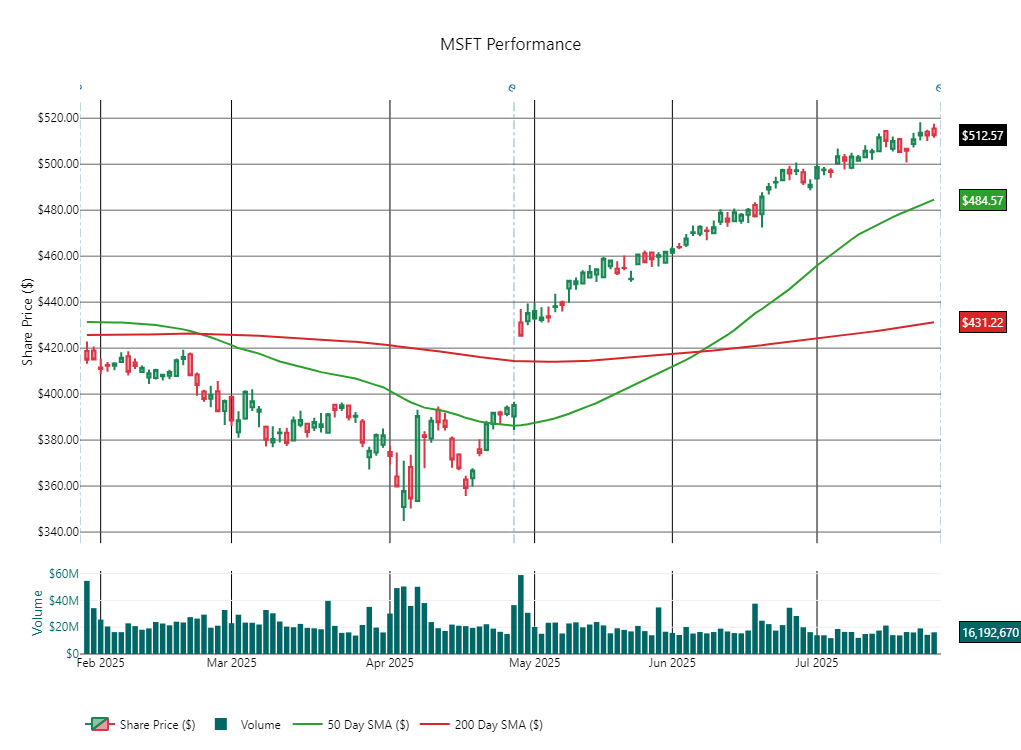
As of July 29, 2025 | Price: $512.57
🔹 Key Fibonacci Levels (Trend: $456.89 → $518.29)
- Resistance: $518.29 (0% Fib, recent high)
- Support Levels:
- 1st: $503.27 (23.6% Fib)
- 2nd: $493.18 (38.2% Fib)
- 3rd: $487.59 (50% Fib)
- 4th: $482.00 (61.8% Fib, key pivot zone)
🔹 Technical Indicators
- RSI: 69.67 → Near overbought; watch for short-term consolidation or pullback.
- 50-day SMA: $484.57 → Price above = bullish.
- 200-day SMA: $431.22 → Long-term trend strong and intact.
- Volume: Flat/near average = lack of strong conviction either way.
🔹 Actionable Takeaways
- Uptrend remains intact with price above both 50- and 200-day SMAs.
- $518.29 is critical resistance—a breakout could trigger further upside.
- First support to watch: $503.27 → if broken, downside could extend to $493 or even $482.
- RSI near 70 suggests short-term exhaustion; expect pause or pullback unless new catalyst emerges.
- No volume surge = likely consolidation phase near highs unless triggered by news or earnings.
📌 Outlook:
MSFT is in a strong uptrend but nearing resistance and overbought conditions. Traders should watch for either a breakout above $518.29 or a pullback to the $503–$482 support range.
Disclaimer: This report is AI-generated and for informational purposes only. It does not constitute financial advice.