
Netflix (NFLX) Technical Analysis: Bullish Signals indicate potential upside
1. Trend Overview
- Long-term trend = Uptrend
Price remains well above the 200-day SMA ($1,129) and is recovering after a pullback. - Medium-term trend = Weakening but stabilizing
50-day SMA ($1,178) is sloping downward but price has reclaimed the 200-SMA → bullish stabilization. - Short-term trend = Turning up
Last 2–7 days show higher lows and improving momentum.
📊 2. Key Indicators
RSI
- Current RSI ranges (short to long): 37–54
- Short-term RSI (5–7 days) is still soft/oversold-ish (37–39)
- Medium-term RSI (20–31 days) = 41–45 → Neutral
- Long-term RSI (365 days) = 54 → Still in bull trend
→ Momentum is shifting from oversold → recovery.
Williams %R
- Near-term Williams = –59% to –85%, deeper oversold on longer windows.
- 365-day Williams = –32%, healthy long-term uptrend.
→ Oversold signals lining up with a bounce already in progress.
ADX (trend strength)
- Short-term ADX = 34–52 → Strong trend, but this was during the recent down-leg.
- Medium/long-term ADX weakens significantly (8–13) → No major long-term trend change.
→ Selling pressure was strong but is fading. Buyers are now reasserting.
Volatility (STD)
- Recent STD = 50–60
- 180–200 day STD = 119–120
- 365 day STD = 221
→ Current volatility is much lower than long-term norms.
→ Split + earnings cycle + bounce = volatility expansion likely ahead.
🟥 3. What the Charts Show
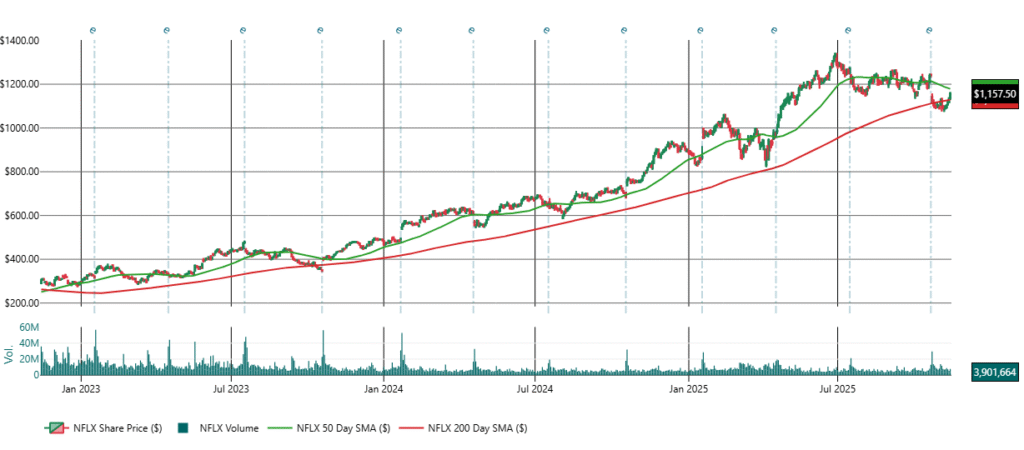
Long-Term Chart (2-year)
- NFLX has been in a clear structural uptrend since early 2023.
- Higher highs + higher lows are intact.
- Repeated 50-day SMA resets followed by trend continuation.
Big-picture: Trend remains bullish.
1-Year Chart
- Peaked around $1,300–$1,320
- Pulled back to the $1,100–$1,120 support
- Buyers stepped in exactly at the 200-day SMA.
This looks like a classic retest of major support → bounce.
6-Month Chart
- Price slipped under 50-day SMA but found strong support at the 200-SMA.
- Current price back above the 200-SMA → bullish early reversal.
3-Month Chart
- Detailed candles show:
- Breakdown in early Oct
- Capitulation wick on heavy volume
- Gradual stabilization
- Higher lows forming now
- 50-day SMA still declining, but flattening → reversal setup.
🔍 4. Pattern Detection
Based on the uploaded charts:
Pattern #1: Rounded Bottom / U-shaped recovery
- Forming between Oct 10 – Nov 10
- Higher lows confirm demand returning.
Pattern #2: 200-day SMA Bounce
- Strong bullish signal in trending names.
- Historically NFLX rallies 10–25% from 200-SMA touches.
Pattern #3: Mini Inverse Head & Shoulders
- Left shoulder: ~Oct 8
- Head: ~Oct 21 low
- Right shoulder: Nov 5–8
Neckline = ~$1,185
A break above this completes a bullish pattern.
🎯 5. Key Price Levels
Support
- $1,120 (strong) – 200-day SMA
- $1,080 – recent capitulation zone
- $1,000 psychological
Resistance
- $1,178–1,185 = 50-day SMA + neckline
- $1,240 minor
- $1,300–1,320 major, yearly high
📌 6. Stock Split Impact (Nov 17)
Expect:
- Short-term volatility spike
- Retail inflow
- Options volume increase
- Often triggers a pre-split run-up, especially when technicals align (bouncing off 200-SMA).
NFLX historically trades well into splits.
🧭 7. Actionable Opinion
Bullish case (higher probability)
NFLX bounced from a big support (200-day SMA) and is gaining strength. If it breaks above $1,185, it can run toward:
- $1,240
- $1,300 (pre-split high)
- $1,350 extension after the split liquidity wave
Bearish case
If it loses $1,120, sellers take control again.
Downside targets:
- $1,080
- $1,000
✔️ Summary
NFLX is bouncing off its 200-day SMA after a multi-week pullback, with RSI recovering, selling pressure easing, and a potential inverse head-and-shoulders forming. Above $1,185 triggers a bullish continuation toward $1,240 and possibly $1,300. The upcoming Nov 17 stock split may add momentum. A drop below $1,120 invalidates the recovery.
Disclaimer: This AI-assisted analysis is for educational purposes only and is not financial advice. Always do your own research or consult a licensed professional before making investment decisions.