
S&P 500 ($SPX) Maintains Uptrend Despite Recent Decline
Market Context
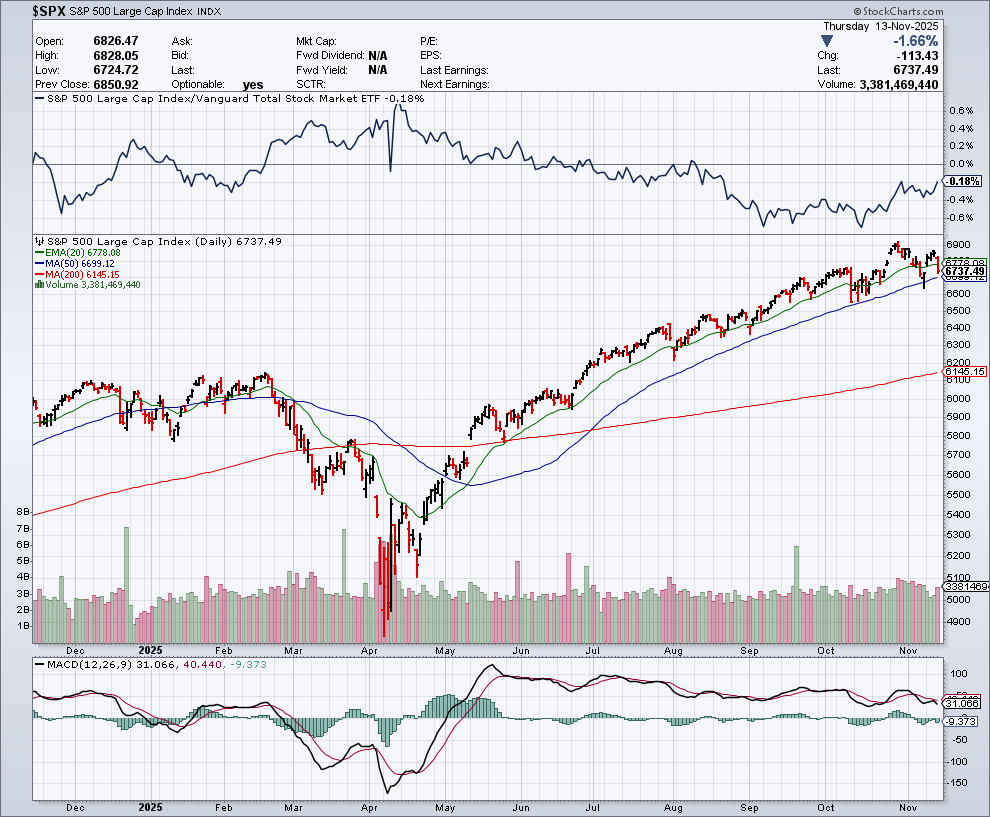
The S&P 500 declined 1.66% to 6,737.49, pulling back sharply into a major support cluster. Despite the drop, the broader uptrend remains intact as long as 6,700 holds.
📈 Trend & Pattern Structure
- SPX continues to trade inside a rising channel that began in April.
- Price has consistently respected both the ascending trendline and the 50-day moving average.
- Today’s decline stopped exactly at that support convergence, preserving the uptrend.
Primary Pattern:
➡ Ascending Channel / Trendline Support
Status:
➡ Uptrend intact unless support breaks
📉 Critical Downside Level
➡ 6,700 — Must-Hold Support
This level is critical because it combines:
- The ascending trendline
- The 50-day MA (~6,699)
- A multi-week support shelf
Breakdown Triggers
- Close < 6,700 → first warning
- Two closes < 6,650 → confirmed trend break
- Downside targets: 6,500 → 6,300 → 6,150 (200-day MA)
📈 Upside Levels
If 6,700 holds, the uptrend is expected to continue.
- First resistance: 6,800 – 6,830
- Breakout target: 6,950
- Channel extension: 7,150 – 7,200
📊 Indicators
- MACD: Momentum weakening; watching for a bear cross. Not confirmed yet.
- Volume: Elevated but not capitulatory — consistent with a normal pullback in trend.
- Relative Strength: Still making higher lows, matching a trending market.
📝 Summary
- The entire bullish structure hinges on 6,700.
- A bounce here would maintain the rising channel with upside toward 6,950–7,200.
- A break below 6,700, especially confirmed under 6,650, would signal a trend reversal with room to retrace toward 6,500 and potentially 6,300.