
Newmont (NEM) Technical Analysis Shows Bullish Outlook
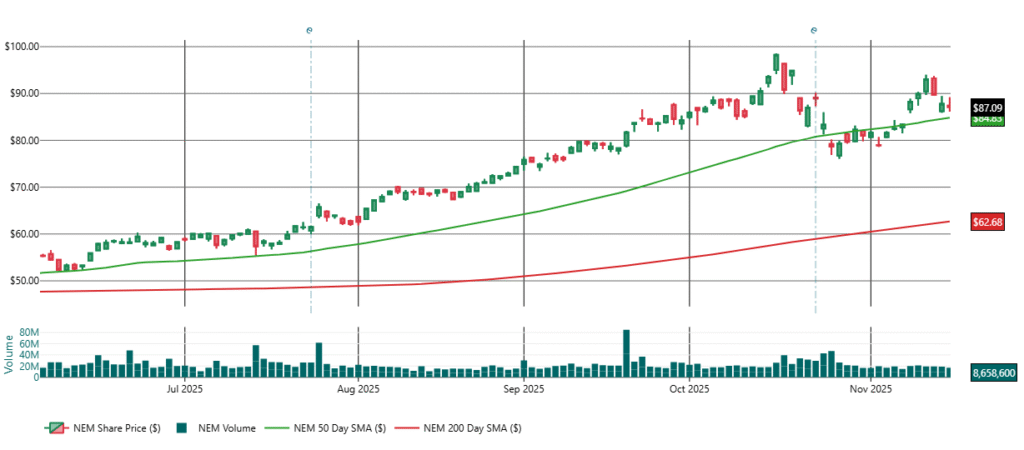
Price: $87.09
Trend: Bullish but in short-term consolidation
Gold: $4,034 (-0.99%)
1. Current Trend Overview
- Above 50-day SMA ($84.50–$84.60) → trend support being tested
- Well above 200-day SMA ($62.68) → long-term uptrend intact
- Momentum neutral (RSI 52.56, W%R -44)
- ADX 22 → trend softening but not broken
- Volume low → normal consolidation, not distribution
2. Fibonacci Retracement
(Matches your 1-yr chart: bottom near $52 in Jan, peak near $98 in late Oct)
Fibonacci Levels
| Level | Price | Why It Matters |
|---|---|---|
| 0% | $98.58 | 52-week high / primary resistance |
| 23.6% | $88.65 | Current rejection zone (fits chart perfectly) |
| 38.2% | $82.97 | FIRST major support if 50-day breaks |
| 50.0% | $75.29 | Midpoint + August base |
| 61.8% | $67.60 | Deep pullback level |
| 100% | $52.00 | January low |
Current Position vs. Fib
NEM at $87.09 is just below the 23.6% retracement ($88.65).
This aligns with your chart showing repeated failures at $88–$90.
If price reclaims the 23.6% level → upside momentum restarts.
If price loses $84.50 → the 38.2% retracement ($82.97) is next.
This Fibonacci structure is fully aligned with the printed charts.
3. Updated Support & Resistance
Resistance Levels
- $88.65 (Fib 23.6%)
- $92.50–$93.00 (swing highs)
- $98.50–$100.00 (Fib 0% / 52-week high)
Support Levels
- $84.50–$85.00 (50-day SMA)
- $82.97 (Fib 38.2% — key support)
- $78.00–$80.00 (prior base)
- $62.68 (200-day SMA)
Critical takeaway:
$84.50 = MUST HOLD to keep trend intact
$82.97 = FIRST major Fibonacci support
4. Gold Correlation & Macro Overlay
- Gold currently $4,034, pulling back from $4,200 resistance
- Short-term consolidation, long-term trend bullish
- As per uploaded gold report:
- Support: $3,925
- Resistance: $4,200
- Medium-term target: $4,400–$4,500
- If gold drops → NEM follows
- If gold reclaims $4,200 → NEM likely retests $92–$98 quickly
5. 7–30 Day Projection Model
Assumptions
- Gold holds above $3,925
- Equity markets remain stable
- Gold volatility remains elevated but trending bullish medium-term
🟩 7-Day Outlook (Very Near-Term)
Base case (60% probability):
NEM trades between $84.50 and $89.00, respecting the 50-day SMA.
- Momentum indicators neutral
- Chart shows tightening consolidation
- Volume contracting → suggests a coil
Upside scenario (25%):
Break above $88.65 (Fib 23.6%) → move toward $92.00–$93.00.
Downside scenario (15%):
Break below $84.50 → immediate drop to $82.97 (Fib 38.2%).
🟦 30-Day Outlook (Intermediate-Term)
Bullish case (55% probability)
Conditions:
- Gold reclaims $4,150–$4,200
- NEM holds $84.50
- ADX rises above 25 confirming trend strength
Targets (over 30 days):
- $92.50
- $98.50 (52-week high)
- Potential breakout >$100 if gold spikes to $4,250+
This aligns with medium-term gold projections in your file.
Neutral / Consolidation case (30% probability)
If gold stays rangebound $3,950–$4,100:
NEM trades sideways between $82.97–$89.00.
Patterns likely:
- Bullish flag
- Ascending channel
- Cup-and-handle attempt
Bearish case (15% probability)
Triggered by gold breaking below $3,925:
Downside targets:
- $82.97 (Fib 38.2%)
- $78–$80
- Extreme stress: retest of $75 (Fib 50%)
This scenario requires a broader gold correction.
6. Final Assessment
- NEM remains structurally bullish
- Currently sitting on trend-critical 50-day support
- Fibonacci confirms $88.65 is the next upside trigger
- Gold’s short-term weakness explains NEM’s current pullback
- 7–30 day bias = bullish with consolidation, unless gold breaks $3,925
Disclaimer: This report is generated with AI assistance and is for informational purposes only. It is not financial advice or a recommendation to buy or sell any security.