
Lululemon (LULU) Pre-Earnings Outlook Indicates Potential Upside
Earnings: Dec 11, 2025
Current price: ~$190
1. What Matters Fundamentally Into This Earnings
A. Valuation Reset (Key Point)
- LULU is trading at ~19–21x forward earnings, far below its 5-year average ~35x.
- Market now prices it like a mature brand (similar to NKE) rather than a premium growth name.
- This creates a GARP setup: strong margins + mid-teens EPS potential at a compressed multiple.
B. Growth Split: U.S. Slowdown vs China Acceleration
- Americas: very weak +1–3% growth; category saturation + fashion trend headwind.
- International: +25% growth, with China the engine. Store productivity is high; competitive moat still intact.
→ Street expectations are low for U.S. but high for China.
If China accelerates again → major bullish reaction.
C. Margins & Cash Flow: Still Best-in-Class
- Gross margin ~57–58% (top-tier).
- Operating margin ~21%.
- No long-term debt; strong FCF; $1B+ buybacks last 12 months.
→ This gives the stock a fundamental floor around the $150–170 zone.
D. Key Bear Risks Still Active
- Alo/Vuori taking share in the U.S.
- Fashion cycle shifting away from tight athleisure.
- U.S. women’s saturation → the core market is structurally slowing.
- If China shows ANY deceleration → the thesis breaks.
E. Earnings Setup
- Est Growth: Revenue +3.6% YoY, EPS YoY down (margin pressure).
- Expectations are low → “less bad = relief rally” setup.
Bottom Line (Fundamental):
The stock is oversold on sentiment, undervalued vs history, and China is the swing factor. If China and margins hold, this becomes a powerful re-rating story. If not, $170–160 comes fast.
2. Technical Outlook
A. Trend Structure
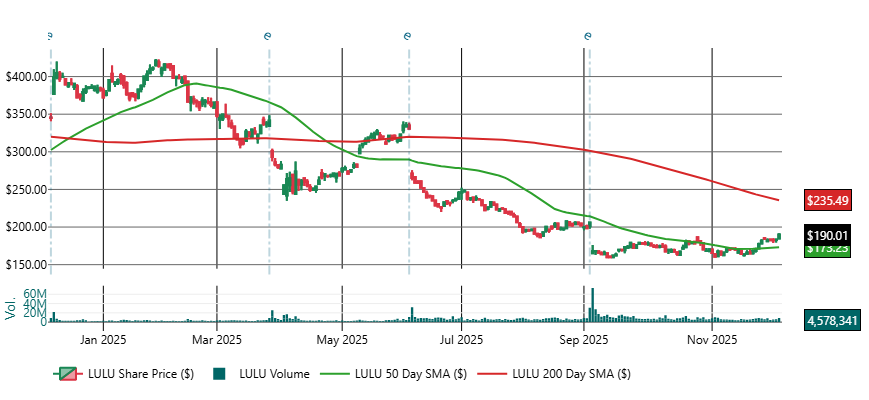
- Long-term trend: Bearish (200 SMA sloping down from $300→$235).
- Short-term trend: Improving (price above 50 SMA ~$173).
- Price forming 3-month base after 12-month downtrend.
B. Current Position
- Price: $190
- Above 50 SMA → early improvement
- Far below 200 SMA → long-term bearish
- Multi-month range: $173–$200
C. Key Levels
Support:
- $173 (50-day SMA)
- $160–170 base
- $150 capitulation shelf
Resistance:
- $200–205 first wall
- $235 (200-day SMA)
- $260–270 breakdown level
D. Technical Character
- Markets have punished LULU after every earnings for 4+ quarters despite beats.
- Current price action is compression — a large move is upcoming.
3. Integrated Pre-Earnings Map
Bullish Trigger
- Break & hold above $200–205
→ would signal buyers stepping in ahead of international strength or improving margin commentary.
→ Upside path: $220 → $235 test.
Bearish Trigger
- Break below $173
→ means U.S. weakness or China slowdown commentary.
→ Downside path: $165 → $150.
Breakout Zone
- $205–235
This aligns with fundamental re-rating potential if holiday guide is strong.
Capitulation Zone
- $150–160
This is the “market pricing in structural decline” zone.
Fundamentally supported by cash flow + no debt, but still vulnerable to China risk.
Compression Zone (Current)
- $173–200
Stock is storing energy for a post-earnings directional move.
4. The Combined Earnings Setup
If Earnings Are Strong / Guide Up
- China momentum + margin strength → massive relief rally likely.
- Technicals support a $205 breakout, leading to $220–235.
- Market realizes valuation has compressed too far.
If Earnings Are In-Line / Soft Guidance
- U.S. weakness dominates → stock likely returns to $173, possibly $165.
- Pattern continues where LULU rallies into earnings but fades after.
If China Slows
- This is the “thesis break”.
- Immediate reaction likely $160–150.
5. Summary
Fundamental View:
- Underpriced vs history (20x vs 35x avg).
- Strong margins, no debt, heavy buybacks.
- U.S. weakness offset by China hyper-growth.
- Key risk: fashion cycle & competition (Alo/Vuori).
Technical View:
- Short-term base; long-term downtrend intact.
- Price pinned between $173 support and $200 resistance.
- Volatility event highly likely.
Pre-Earnings Bias:
- Neutral inside $173–200.
- Breakout potential if China & margins outperform.
- Downside if holiday guide weak or China slows.
This is AI-assisted market analysis for informational and educational purposes only and is not a recommendation or advice to buy, sell, or trade any security.