Roku (ROKU) Stock Analysis: Consolidation with Key Support and Resistance Levels
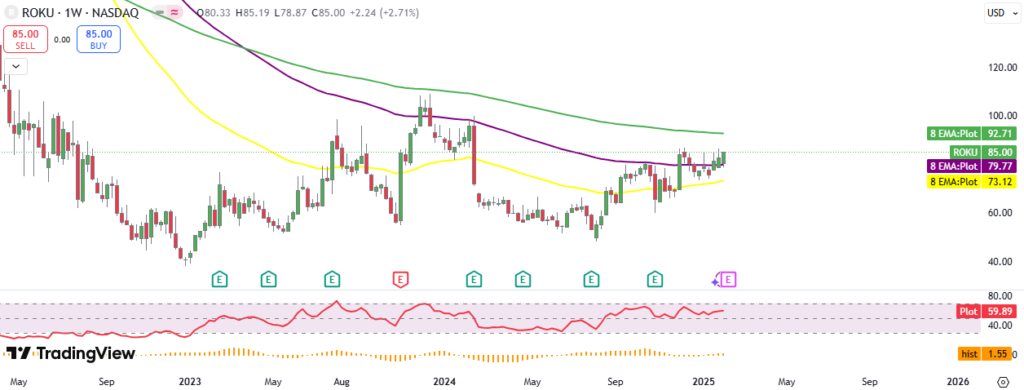
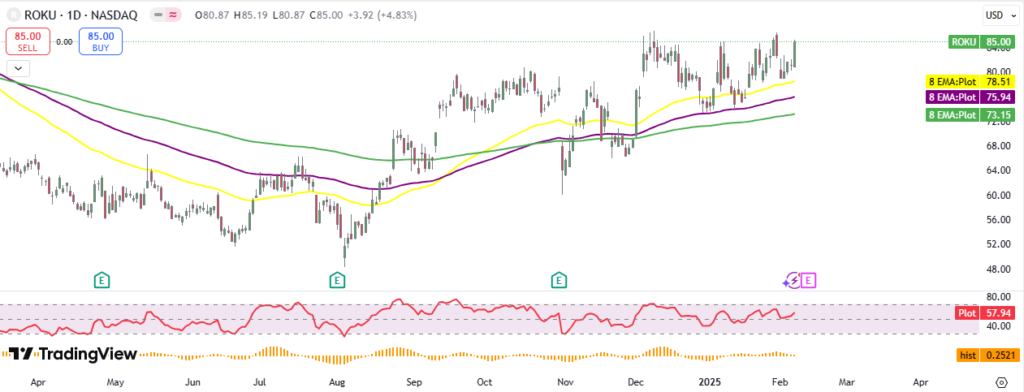
The stock closed the week at $85, up 2.72%. It gained 4.83% on Friday.
The price is trading between the 100 and 200-week EMAs. Previously, the 100-week EMA acted as resistance but is now serving as support. The next resistance level is at the 200-week EMA. Currently, the 50, 100, and 200-week EMAs are at $73.12, $79.77, and $92.71, respectively. The weekly RSI is at 60, and the MACD is bullish.

The price is above the 50, 100, and 200-day EMAs, reflecting a short-term bullish bias. The 50, 100, and 200-day EMAs are at $78.5, $75.9, and $73.1, respectively. These EMAs are acting as strong support, keeping the price elevated. The daily RSI is at 58, and the MACD is bullish.

The price is currently consolidating between $85 and $75. Immediate resistance is at $85, while support lies in the $73–$78 range.
